import pysegy
import urllib, gzip, os, shutil
import matplotlib.pyplot as pltScanning the BP dataset with pysegy
This notebook demonstrates how to download the BP 1994 2-D seismic dataset, scan it using the pysegy utilities and then visualise the source and receiver positions as well as a few shot or receiver gathers.
bp_url = 'http://s3.amazonaws.com/open.source.geoscience/open_data/bpstatics94/7m_shots_0601_0869.segy.gz'
local_gz = '7m_shots_0601_0869.segy.gz'
local_segy = '7m_shots_0601_0869.segy'

if not os.path.exists(local_segy):
    print('Downloading BP dataset...')
    with urllib.request.urlopen(bp_url) as resp, open(local_gz, 'wb') as f:
        shutil.copyfileobj(resp, f)
    with gzip.open(local_gz, 'rb') as gz, open(local_segy, 'wb') as out:
        shutil.copyfileobj(gz, out)
# Scan the SEGY file to find shot locations and offsets
scan = pysegy.segy_scan(local_segy)
fh = scan.fileheader
print(f'Total shots: {len(scan)}')
print('Samples per trace:', fh.bfh.ns)
Scanning 1 files in . with 8 threads
ThreadPoolExecutor-0_0 scanning file 7m_shots_0601_0869.segy
Header for 7m_shots_0601_0869.segy: ns=1152 dt=5400
ThreadPoolExecutor-0_0 found 135 shots in 7m_shots_0601_0869.segy
Combined scan has 135 shots
Total shots: 135
Samples per trace: 1152# Display human-readable headers
fhBinaryFileHeader:
Job : 0
Line : 0
Reel : 1
DataTracePerEnsemble : 3008
AuxiliaryTracePerEnsemble : 0
dt : 5400
dtOrig : 0
ns : 1152
nsOrig : 0
DataSampleFormat : 1
EnsembleFold : 0
TraceSorting : 0
VerticalSumCode : 0
SweepFrequencyStart : 0
SweepFrequencyEnd : 0
SweepLength : 0
SweepType : 0
SweepChannel : 0
SweepTaperlengthStart : 0
SweepTaperLengthEnd : 0
TaperType : 0
CorrelatedDataTraces : 0
BinaryGain : 0
AmplitudeRecoveryMethod : 0
MeasurementSystem : 2
ImpulseSignalPolarity : 0
VibratoryPolarityCode : 0
SegyFormatRevisionNumber : 256
FixedLengthTraceFlag : 1
NumberOfExtTextualHeaders : 0example_hdr = scan.read_headers(0, keys=['SourceX', 'GroupX', 'ns', "dt", "SourceDepth"])[0]
example_hdrBinaryTraceHeader:
SourceX : 12500
GroupX : 5000
ns : 1152
dt : 5400
SourceDepth : 6250# Access ShotRecord directly and use lazy data
rec = scan[0]
hdr = rec.read_headers(keys=['SourceX'])[0]
block = rec.data
blockarray([[0., 0., 0., ..., 0., 0., 0.],
[0., 0., 0., ..., 0., 0., 0.],
[0., 0., 0., ..., 0., 0., 0.],
...,
[0., 0., 0., ..., 0., 0., 0.],
[0., 0., 0., ..., 0., 0., 0.],
[0., 0., 0., ..., 0., 0., 0.]], shape=(1152, 3008), dtype=float32)# Receiver coordinates for a shot
rec = scan[0]
coords = rec.rec_coordinates
plt.figure(figsize=(6,4))
plt.scatter(coords[:,0], coords[:,1], s=2)
plt.xlabel('GroupX')
plt.ylabel('GroupY')
plt.title('Receiver positions for first shot')
plt.show()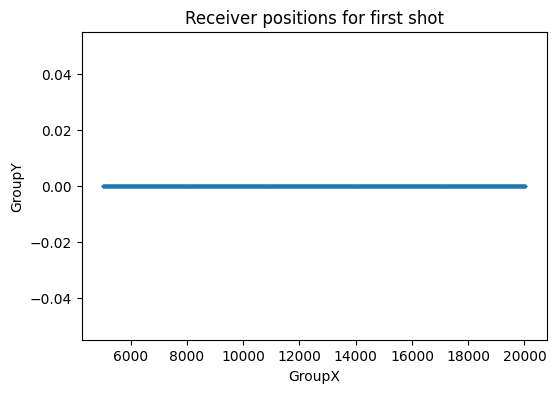
plt.plot(scan.counts)
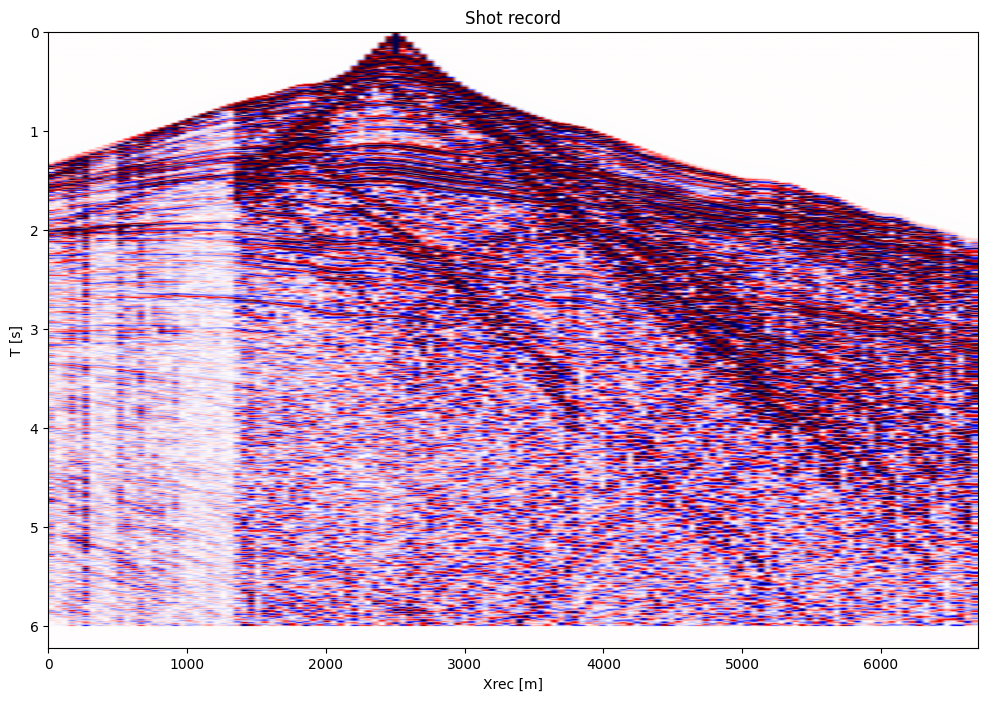
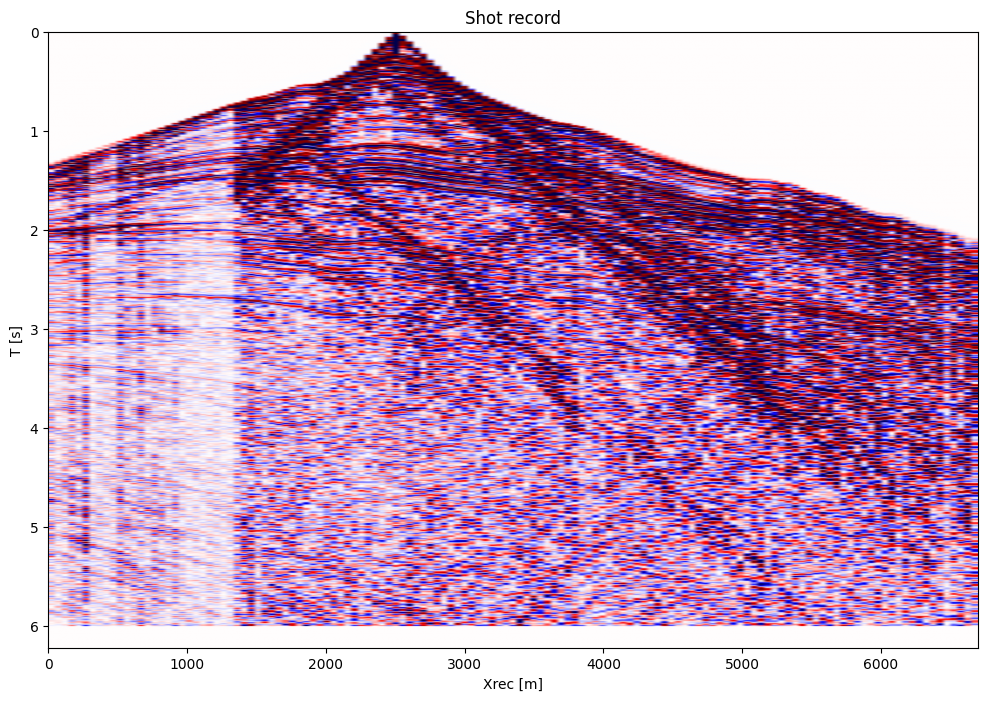
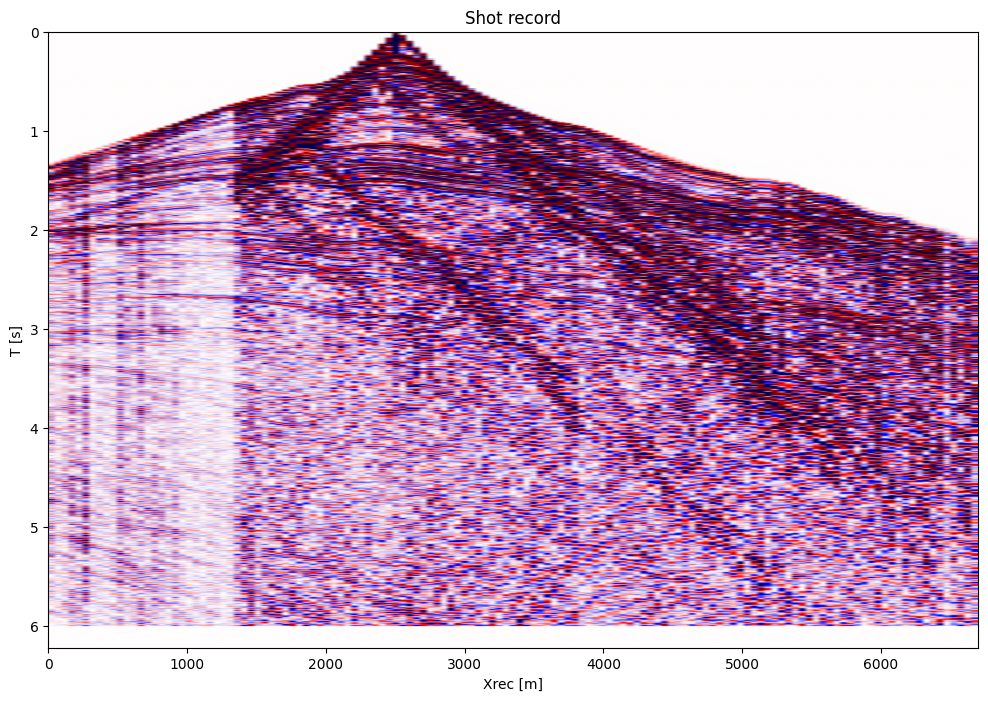
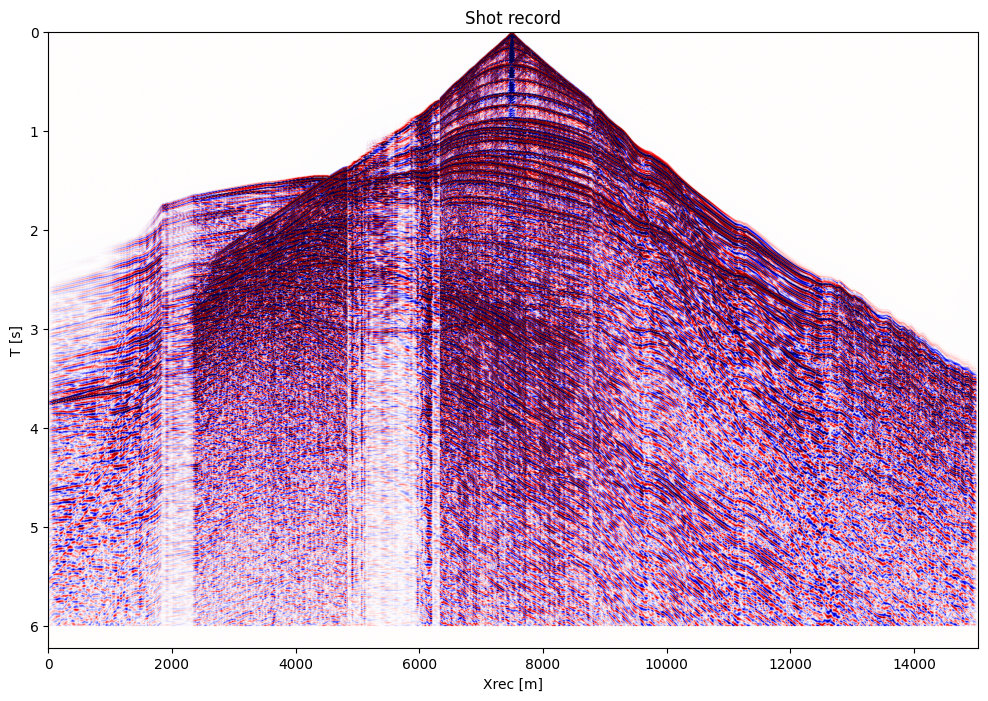
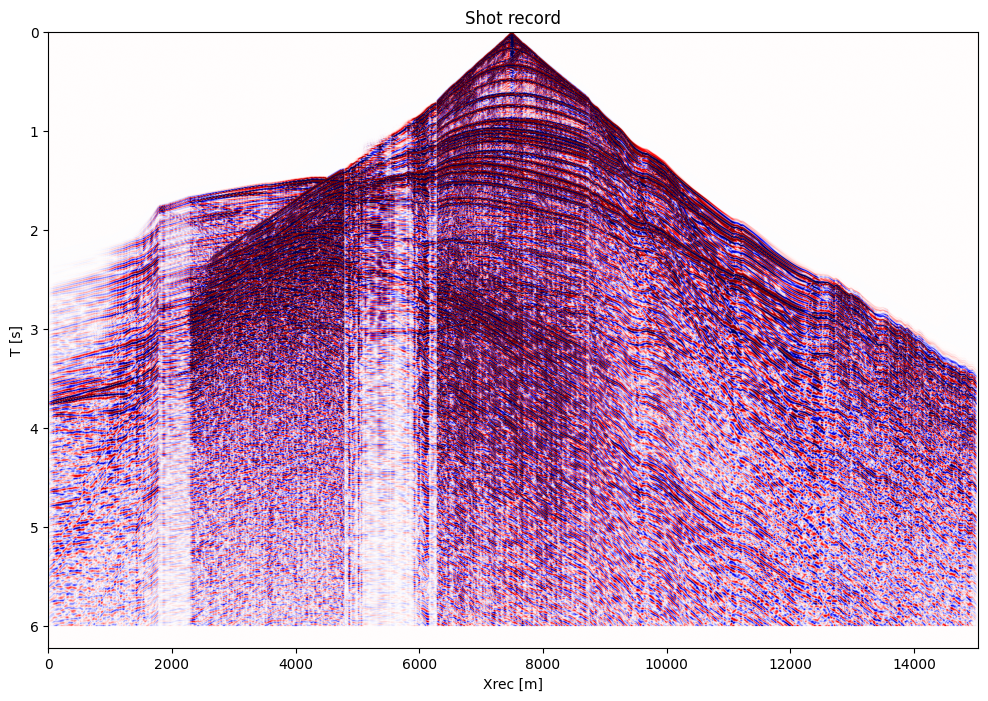
# Plot a few shot gathers using the lazy reader
for i in range(3):
    block = scan[i]
    print(f'Shot {i+1} - Samples: {block.data.shape[0]}, Traces: {block.data.shape[1]}')
    plt.figure(figsize=(12, 8))
    pysegy.plot_sdata(block, perc=90, new_fig=False, cmap="seismic")
Shot 1 - Samples: 1152, Traces: 3008
Shot 2 - Samples: 1152, Traces: 3008
Shot 3 - Samples: 1152, Traces: 3008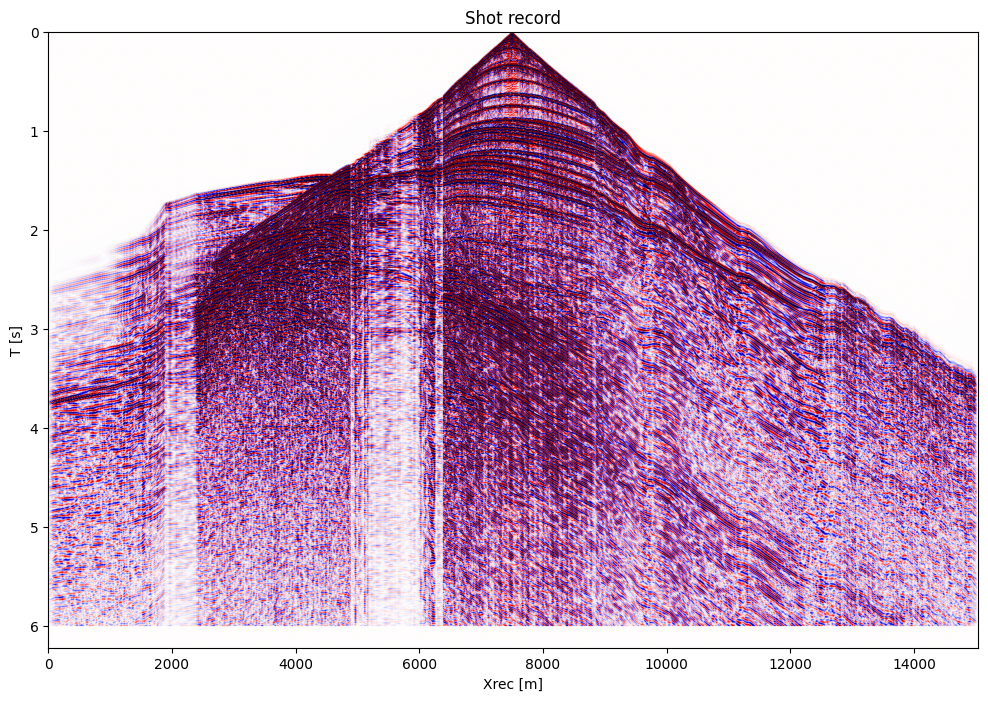
# Receiver spread across all sources
xvals = []
src_ids = []
for i in range(len(scan)):
    hdrs = scan.read_headers(i, keys=['GroupX'])
    xvals.extend(h.GroupX for h in hdrs)
    src_ids.extend([i] * len(hdrs))
plt.figure(figsize=(8,5))
plt.scatter(xvals, src_ids, s=2)
plt.xlabel('X')
plt.ylabel('Source number')
plt.title('Receiver spread')
plt.show()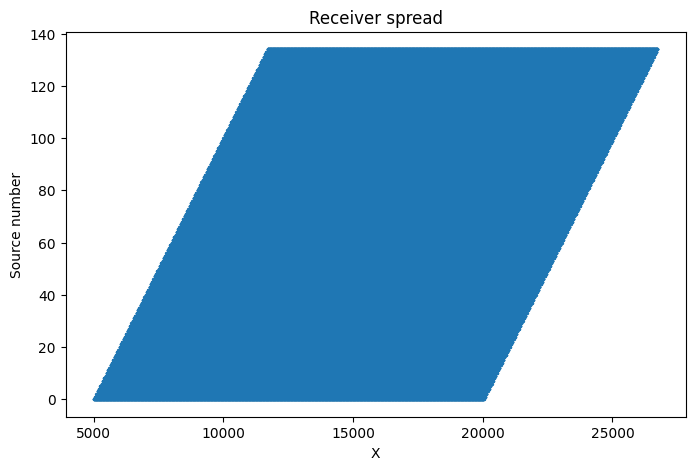
Scan by receiver coordinates and plot a gather
rec_scan = pysegy.segy_scan(local_segy, by_receiver=True)
print(f'Total receiver gathers: {len(rec_scan)}')
Scanning 1 files in . with 8 threads
ThreadPoolExecutor-4_0 scanning file 7m_shots_0601_0869.segy
Header for 7m_shots_0601_0869.segy: ns=1152 dt=5400
ThreadPoolExecutor-4_0 found 4348 shots in 7m_shots_0601_0869.segy
Combined scan has 4348 shots
Total receiver gathers: 4348plt.plot(rec_scan.counts)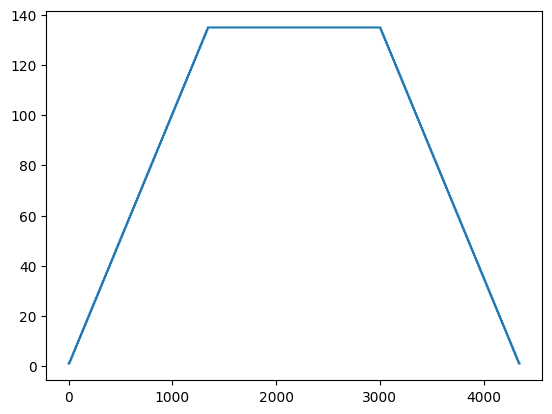
# Plot a few receiver gathers using the lazy reader
for i in range(3):
    block = rec_scan[2000+i]
    print(f'Receiver gather {i+1} - Samples: {block.data.shape[0]}, Traces: {block.data.shape[1]}')
    plt.figure(figsize=(12, 8))
    pysegy.plot_sdata(block, perc=90, new_fig=False, cmap="seismic")
Receiver gather 1 - Samples: 1152, Traces: 135
Receiver gather 2 - Samples: 1152, Traces: 135
Receiver gather 3 - Samples: 1152, Traces: 135